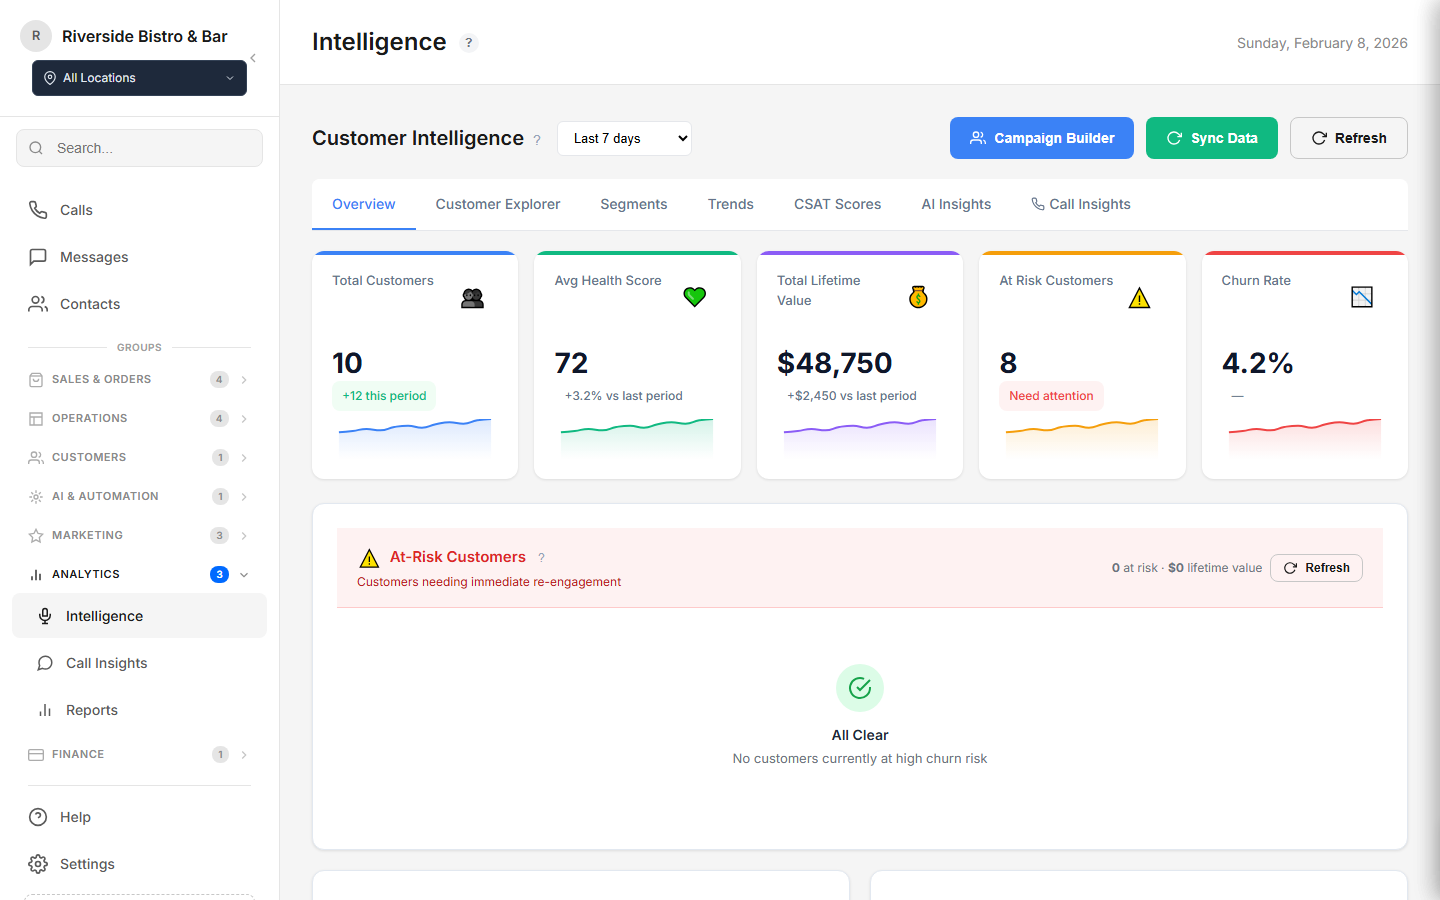
Customer Intelligence
70% of First-Time Guests Never Come Back
The average restaurant retains just 55% of customers — well below the 75% benchmark. Each churned guest represents hundreds in lost lifetime value. Our Customer Intelligence platform identifies at-risk guests before they leave and automatically re-engages them with personalized campaigns that achieve a 15% return rate.
70%
first-time guests never return — Bloom Intelligence, 2025
$375K
annual churn cost per location — Bloom Intelligence, 2025
40%
more revenue from personalization — McKinsey, 2021
scaledgrowthagency.com/client